Amenity Demand and Assortment Planning for Urban Developments


Strategic Question
Which amenities does a new urban district actually need — and which brands should fill them? Master plans define land use zones, but they cannot answer the question that determines whether a district succeeds commercially: what do residents and workers want, at what density, and in what spatial configuration? This project built a data-driven amenity intelligence framework for a large-scale greenfield urban development in the Gulf region, replacing planning intuition with a multi-source demand signal.
Approach
We developed an integrated urban analytics framework combining spatial analysis, social listening, and brand attractiveness scoring to produce a fully evidenced amenity assortment recommendation.
The framework combines:
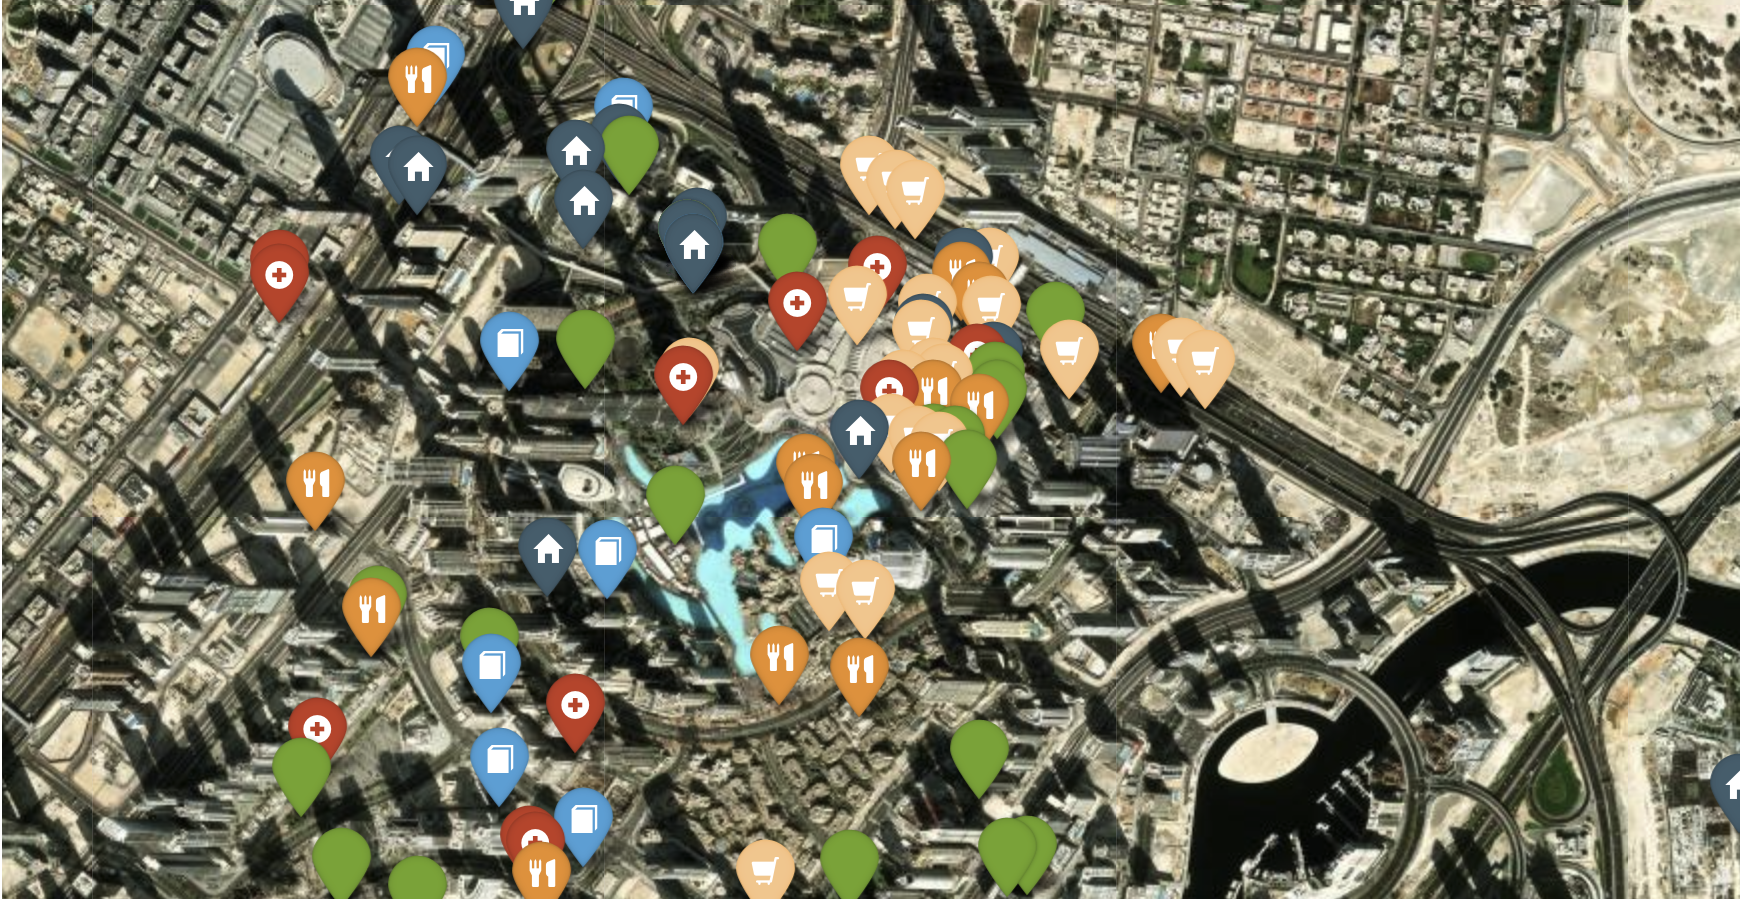
Street network classification and pedestrian catchment modelling to define service hierarchies — local, neighbourhood, and district level
Block-level spatial analysis of the master plan to size and locate community anchors by access mode and visit frequency
Social media corpus analysis across 2+ million geolocated posts and 30,000 urban articles, benchmarking the development against eight comparable cities on quality-of-life dimensions including F&B, retail, healthcare, and mobility
Supervised topic modelling measuring the importance and sentiment of curated urban themes across benchmark cities
Unsupervised topic modelling to surface emerging demand signals not captured in the predefined category list
A brand attractiveness indicator scoring 8,500 international retail brands across 15 categories on three independent signals: global reach (Wikipedia pageview volume), cultural relevance (Instagram presence), and brand sentiment (Twitter mention quality)
The framework is deliberately multi-signal: no single data source — not the master plan, not social media, not brand rankings — is treated as authoritative in isolation. Convergence across sources is what drives the final recommendation.
Outputs
For each amenity category and spatial tier:
Demand intensity score derived from social listening and benchmark city comparison
Recommended service density calibrated to comparable urban contexts
Spatial placement logic by access mode and visit frequency
Brand shortlist per category ranked by the composite attractiveness indicator
Quality-of-life gap analysis identifying underserved themes relative to benchmark cities
Strategic Applications
Amenity mix planning for masterplan districts before lease negotiations or operator outreach
Retail tenant attraction strategy grounded in objective brand performance data
Benchmarking a development's planned offer against established cities competing for the same residents and employers
Identification of emerging demand categories not yet reflected in conventional planning guidelines
Community centre sizing and location optimisation across neighbourhood hierarchies
Input to residential marketing — translating amenity quality into a quantified quality-of-life narrative
The result is a spatially grounded, socially validated amenity intelligence layer — supporting planning decisions that conventional master planning tools and broker relationships cannot produce alone.