Crop Phenology Intelligence from Satellite Time Series
Strategic Question
When does vegetation peak — and does it peak on schedule? Crop calendars are invisible from the ground at scale. This project builds a satellite-native phenological intelligence framework that detects peak greenness timing at pixel level across an entire agricultural landscape, from a dense multi-temporal Sentinel-2 stack.
Approach
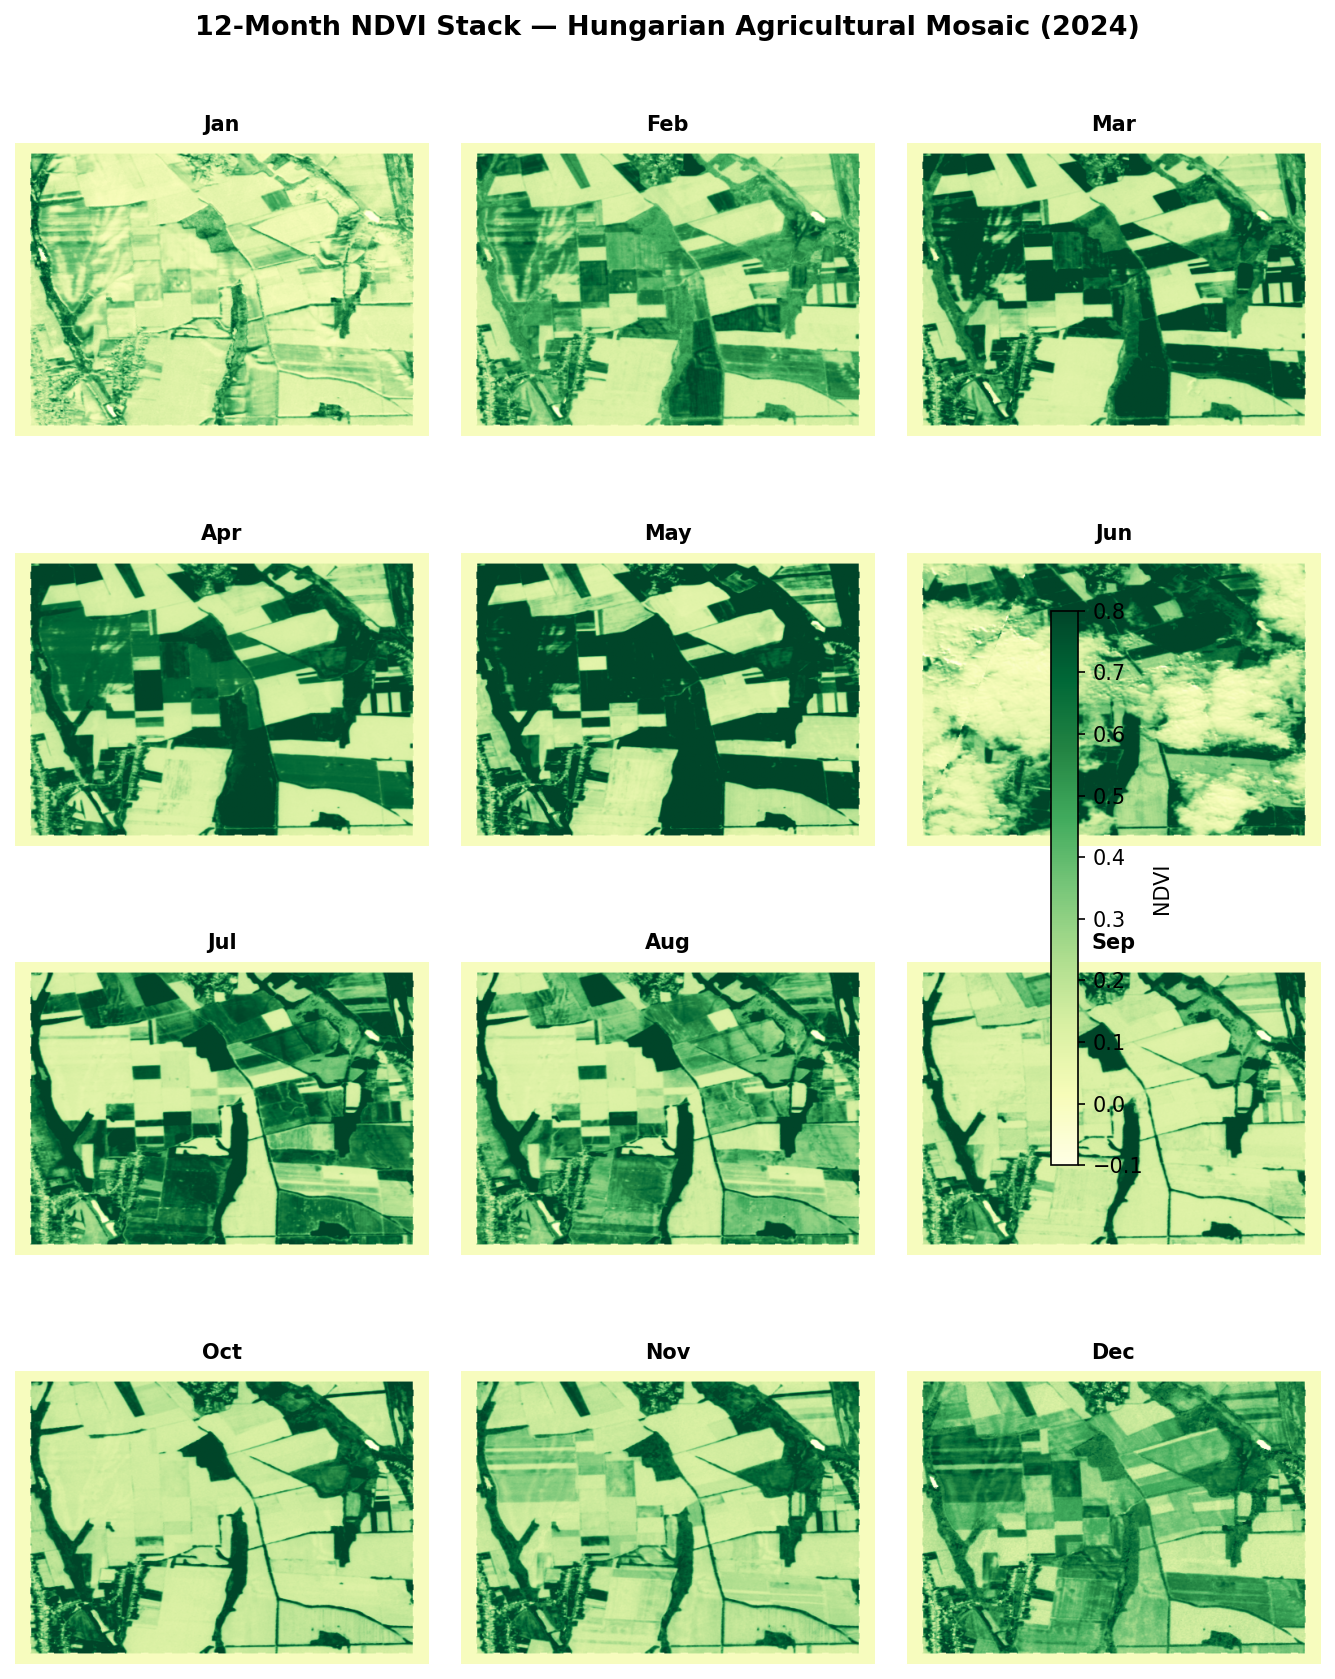
We developed a GeoAI-driven pipeline that processes a series (e.g. monthly or weekly) satellite scenes to extract the full seasonal NDVI cycle at every pixel in the scene.
The framework combines:
Monthly Sentinel-2 NDVI composites (true NIR/Red computation, cloud-filtered)
Pixel-level peak timing detection across the full agricultural calendar
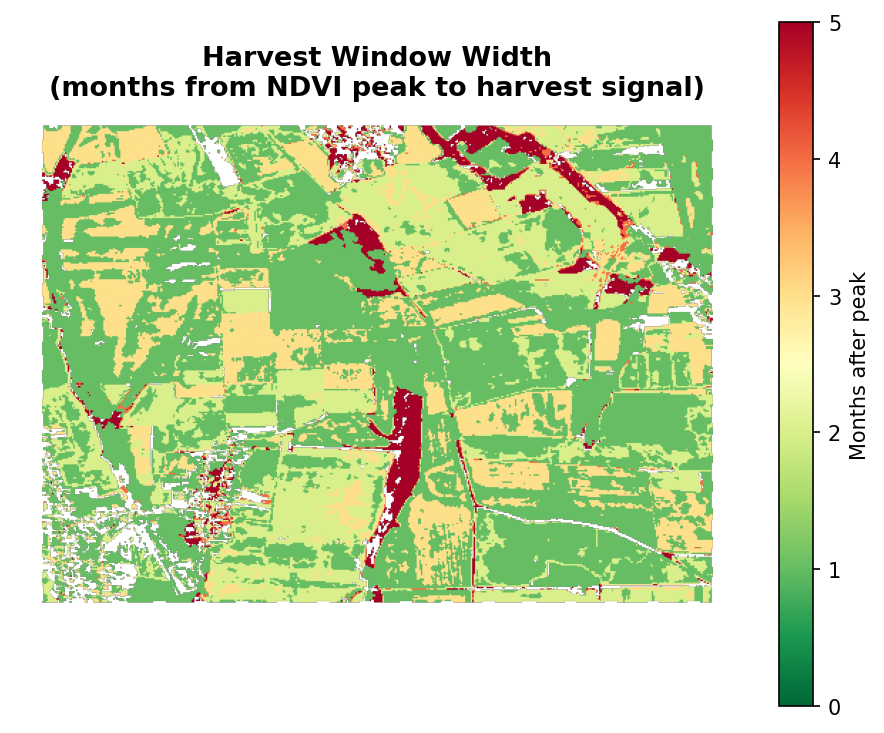
Harvest window estimation from NDVI decline curves
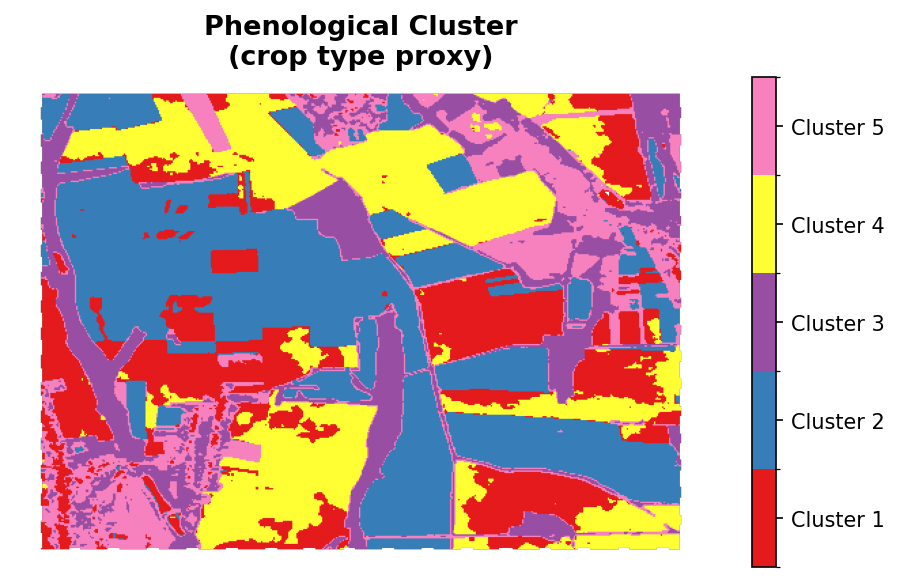
Unsupervised phenological clustering to separate crop types by seasonal signature
Within-cluster anomaly detection to flag parcels deviating from their crop-type norm
The system operates without any labelled training data or field surveys — crop type proxies and stress signals emerge entirely from the temporal structure of the satellite record.
Outputs
For each pixel or parcel:
Peak NDVI month (when greenness crests)
Peak NDVI magnitude (how productive the canopy is at its maximum)
Estimated harvest window (months from peak to decline threshold)
Phenological cluster assignment (crop type proxy)
Anomaly flag (early or late peak relative to crop-type peers)
These signals can be aggregated to field, farm, or regional scale.
Strategic Applications
Harvest timing advisory before ground surveys or broker reports
Crop type discrimination without labelled training data
Yield proxy estimation from peak canopy greenness
Early stress detection for drought, pest pressure, or waterlogging
Agricultural insurance triage — isolating anomalous parcels for claim review
Multi-year phenological shift monitoring under changing climate conditions
The result is a scalable, satellite-native crop intelligence layer derived from physical observation — not administrative records or self-reported field data.